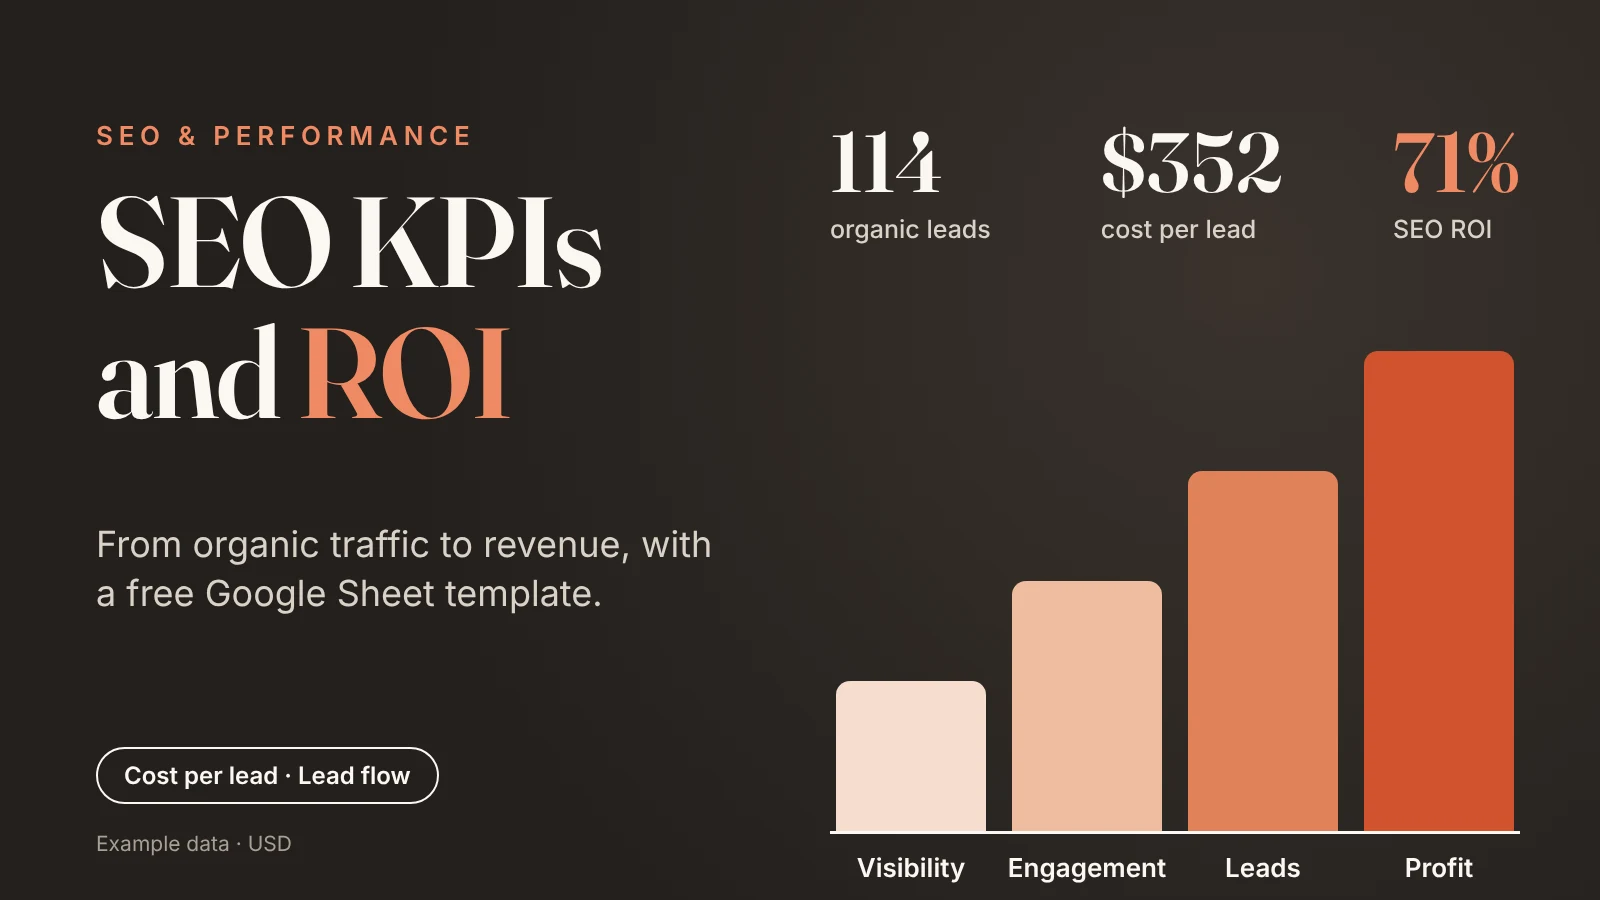
A weekly SEO report that lists impressions, clicks and average position tells a finance director very little about whether the programme deserves its budget. The questions that decide budgets are different: what did each lead cost, how many leads became customers, and what did those customers earn after every cost of winning them?
This guide sets out a three-layer KPI framework, connects it to a lead generation flow that runs from SEO spend to gross profit, and shows how to calculate SEO ROI without the usual distortions. It comes with a free Google Sheet template that does the arithmetic. If you want the fundamentals first, start with What Is SEO? A Comprehensive Guide.
1. Why Most SEO Reports Don’t Get Read.
Many SEO reports are exports. Search Console, GA4 and Semrush each produce a chart, the charts are pasted into a deck, and the reader is left to decide which one matters. The decision-maker wants an answer to one question: is this programme producing profit at an acceptable cost?
Four patterns make a report easy to skip:
- Metrics without targets. A figure of 54,000 impressions cannot be judged until it is compared with a goal.
- Traffic without leads. Sessions say nothing about whether the right people arrived.
- Leads without cost. A rising lead count looks like progress even when the cost per lead is rising faster.
- ROI without the full cost. Agency fees are counted, internal hours and sales time are not, and the result looks better than reality.
A simple test fixes most of this: every metric on the first page must answer one of three questions. Are we visible? Are visitors engaging? Is it producing pipeline and profit? Anything that answers none of them moves to an appendix.
2. SEO KPIs in Three Layers.
The three questions map to three layers of KPIs. Each layer has a different source, a different delay and a different reader.
| Layer | KPIs (source) | How to read them |
|---|---|---|
| Visibility | Impressions, clicks, CTR, average position (Search Console) | Leading indicators that move within weeks. An impression is a link shown in results, and CTR is clicks ÷ impressions (Google, n.d.-b). Read position by page group. |
| Visibility | Keywords in the top 3 and top 10, referring domains (Semrush) | Show whether rankings and authority are building. Referring domains count link growth, not link quality. |
| Engagement | Organic sessions, engagement rate (GA4) | Engagement rate is engaged sessions ÷ sessions (Google, n.d.-a). A drop after a traffic jump often means the new traffic fits the content poorly. |
| Engagement | Key events from organic (GA4) | The actions you define as valuable, such as a form submit. Reconcile them with the lead log. |
| Outcomes | Organic leads, MQL, SQL, customers, revenue won (lead log) | Lagging indicators. They trail rankings by months and are lumpy in B2B. |
| Outcomes | Cost per lead, cumulative ROI (calculated) | The two numbers leadership reads first. |
Three rules keep the framework honest:
- Set one target per KPI from your own history, not from another company’s figures.
- Separate leading from lagging indicators. A visibility KPI that is off track explains a lead shortfall three months later, and the report should say so.
- Use a fixed status rule. The template’s default: On track at or above target, Watch within 10% of target, Off track beyond that. Change the threshold if your volatility is higher.
3. From SEO Spend to Revenue: The Lead Generation Flow.
SEO KPIs only become business numbers once they are linked to a lead generation flow. Every organic visit that turns into a lead passes through the same chain as a lead from any other channel: lead, marketing qualified lead (MQL), sales qualified lead (SQL), opportunity, customer, gross profit. Each handoff has a conversion rate, and each stage has a cost.
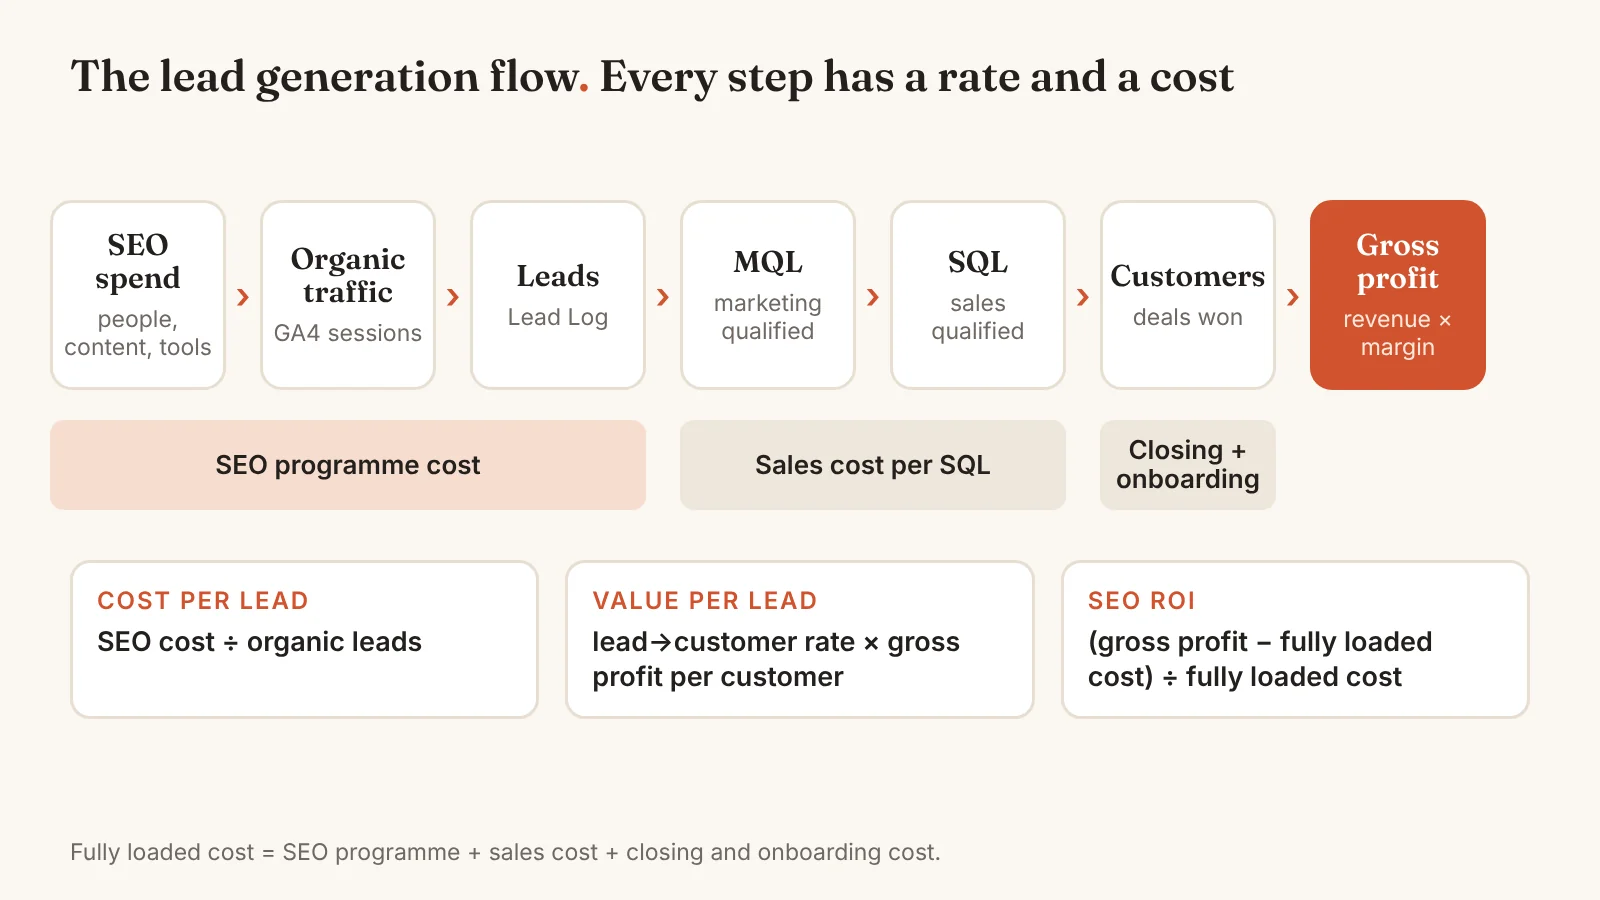
Three cost layers belong in the calculation:
- SEO programme cost: agency or freelancer fees, content production, tools, and internal hours priced at a loaded hourly rate.
- Sales cost: the rep time and tooling spent on each SQL.
- Closing and onboarding cost: proposals, legal review and onboarding for each won deal.
The same chain applies to paid channels, which is what makes organic and paid results comparable. What differs is the timing of the cost and how long the asset keeps producing after the spend stops.
A worked example
The template ships with fictional data for a B2B IT services firm. Over 12 months its SEO programme produced 114 organic leads, 56 MQLs, 32 SQLs, 18 opportunities and 6 customers, a lead-to-customer rate of 5.3%. The six won deals brought in $145,000, about $24,200 each. The SEO programme cost $40,116. Sales time and closing costs added $14,880, so the fully loaded cost was $54,996.
| Stage | Count | Stage conversion | Your target (example) | Flag |
|---|---|---|---|---|
| Lead | 114 | – | – | – |
| MQL | 56 | 49.1% | 50% | Below target |
| SQL | 32 | 57.1% | 45% | At or above |
| Opportunity | 18 | 56.3% | 60% | Below target |
| Customer | 6 | 33.3% | 30% | At or above |
Because targets sit next to actual rates, the bottleneck is visible. Here lead-to-MQL and SQL-to-opportunity fall short, which points at lead qualification and the proposal stage rather than at SEO traffic. Without the funnel view, the same shortfall would show up as “SEO is not producing enough revenue”.
4. How to Calculate SEO ROI (and Why It Isn’t ROAS).
The simplest published formula subtracts the investment from organic revenue and divides by the investment (Darko, 2026). It works as arithmetic but overstates the return, because revenue is not profit and the investment is usually undercounted. The version used in the template follows the stricter definition:
Gross profit is revenue after margin, and fully loaded cost includes internal time. Omitting internal hours is a common way ROI figures get inflated (Chew, 2026).
SEO ROI versus ROAS
Return on ad spend divides revenue by media spend. It suits channels where cost moves with clicks and results arrive quickly. SEO behaves differently, and the two numbers should not be compared directly:
| ROAS (paid media) | SEO ROI | |
|---|---|---|
| Formula | Revenue ÷ ad spend | (Attributed gross profit − fully loaded cost) ÷ fully loaded cost |
| Cost | Variable, paid per click; traffic stops when spend stops | Mostly up-front (content, fixes, people); the assets keep working after spend stops |
| Timing | Days to weeks | Months; early months are usually negative |
| Profit view | Typically revenue only, media cost only | Gross profit, all costs including sales and internal time |
Time horizon changes the answer. A six-month window makes SEO look weak, while a 24-month window usually looks stronger, so the window should match how long the content keeps earning (Chew, 2026). Report the horizon next to the number.
Three scenarios, one honest range
Organic search often starts a buying journey that another channel closes. Last-touch attribution gives all the credit to the final interaction, and in multi-device journeys the credit frequently lands on direct traffic instead of search (Shaffer, 2026).
The template therefore reports ROI in three scenarios. Low counts only leads logged as Organic. Base and High add an assist uplift of 15% and 30%. Those two percentages are placeholders, not measurements: replace them with your own estimate.
| 12-month result | Low | Base | High |
|---|---|---|---|
| Fully loaded cost | $54,996 | $54,996 | $54,996 |
| Attributed gross profit | $94,250 | $108,388 | $122,525 |
| Net profit | $39,254 | $53,392 | $67,529 |
| SEO ROI (profit-based) | 71.4% | 97.1% | 122.8% |
| ROAS-style ratio (revenue ÷ SEO cost) | 3.61x | 4.16x | 4.70x |
| Revenue-based “ROI” | 163.7% | 203.2% | 242.8% |
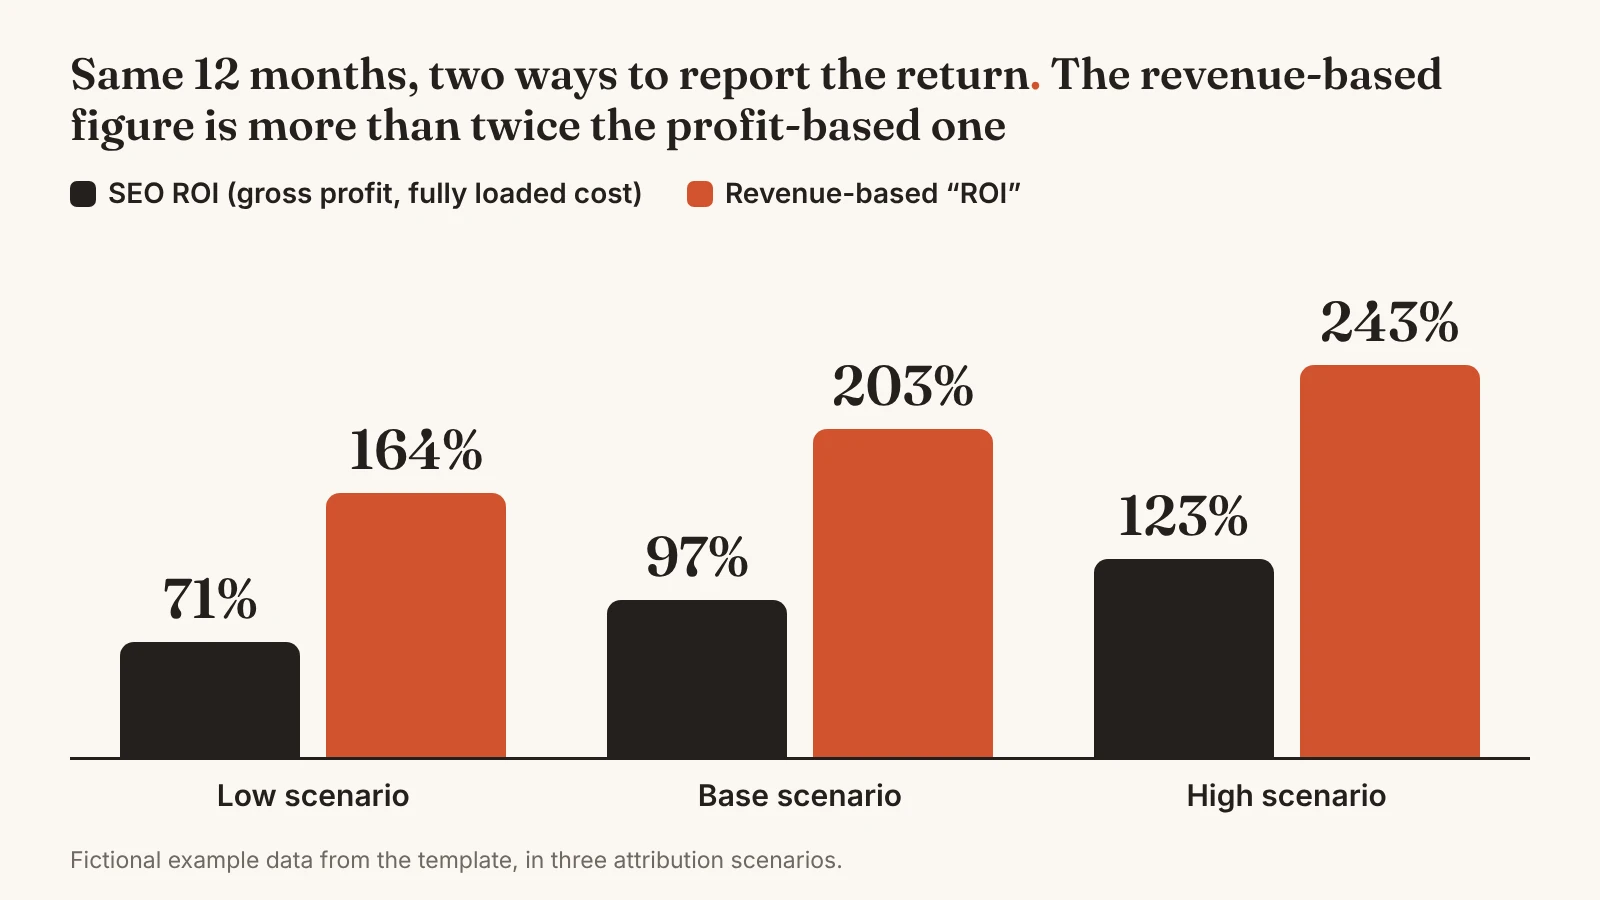
The last two rows show why the definition matters. The same year reads as 71% on a profit basis and as 164% on a revenue basis, a figure more than twice as large. Both are arithmetically correct, but only the first accounts for margin and for everything it cost to win the deals.
The cumulative view adds a second lesson. In the example, cumulative Base ROI sits below zero in every month before July except February, when an early deal briefly lifts it to 15%. It ends June at −7.5%, jumps to 155% in July when $104,500 of deals close, then drifts down to 97% by October as costs continue and no new deals land.
B2B revenue arrives in lumps, so the template reports the break-even month as the first month after which cumulative net profit stays at or above zero, and credits revenue to the month the lead was created. Recent months look weak because deals are still open.
Published ROI averages are hard to use as targets. One 2026 write-up gives the same 748% figure as an average across all industries in one section and as the B2B SaaS median in another (Coussons, 2026). For that reason the template contains no benchmarks.
5. What Is a Lead Worth? Cost per Lead and the Most You Can Pay.
Cost per lead (CPL) is SEO cost divided by organic leads. On its own it cannot say whether a CPL is good, because that depends on what a lead is worth. Value per lead (VPL) closes the gap:
| Metric | Formula | Example |
|---|---|---|
| Lead-to-customer rate | Customers ÷ leads | 6 ÷ 114 = 5.3% |
| Gross profit per customer | Average deal value × gross margin | $24,167 × 65% = $15,708 |
| Value per lead (VPL) | Lead-to-customer rate × gross profit per customer | $826.75 |
| Non-SEO cost per lead | Sales cost + closing cost, per lead | $130.53 |
| Break-even SEO CPL | VPL − non-SEO cost per lead | $696.23 |
| Maximum SEO CPL at 50% target ROI | VPL ÷ (1 + target ROI) − non-SEO cost per lead | $420.64 |
| Actual SEO CPL | SEO cost ÷ organic leads | $351.89 |
The break-even CPL is the hard ceiling: above it each lead loses money. The target-ROI ceiling is the practical one, and the gap to the actual CPL is the headroom. In the example the actual CPL is $351.89 against a $420.64 ceiling, $68.75 of headroom per lead.
What does one unit of SEO money yield?
At a constant CPL the answer is linear. A $10,000 budget buys about 28 leads, which at a 5.3% close rate is 1.5 customers and $23,494 of gross profit, or $2.35 of gross profit per $1 of SEO before sales and closing costs. After those costs the ROI is 71%. Treat this as a comparison tool and not a forecast: real SEO costs are front-loaded and returns compound, so cost per lead usually falls as assets mature.
Two refinements are worth making once the log has enough volume. First, value leads by stage, because an SQL is worth more than a raw lead. Second, split lead value by landing page group, which the Lead Log supports through its landing page column.
6. How to Build the Weekly and Monthly Report.
One data model supports every cadence. Search Console, GA4 and Semrush supply the visibility and engagement layers, and a lead log kept in a spreadsheet supplies the outcome layer. No CRM is required: each lead is one row with its date, channel, landing page and a 1 or 0 flag for each stage. Sales or BD usually hold the stage information, so agree who updates the flags (see mistake 7).
| Cadence | What it answers | Contents |
|---|---|---|
| Weekly | What changed and what needs action? | Headline numbers against last week, top pages and queries, wins, risks and next actions |
| Monthly | Are we on target? | The three-layer KPI table with status, cost per lead, cumulative ROI and the funnel against targets |
| Quarterly | Is the programme worth its budget? | ROI in three scenarios, break-even month, maximum CPL and the budget decision |
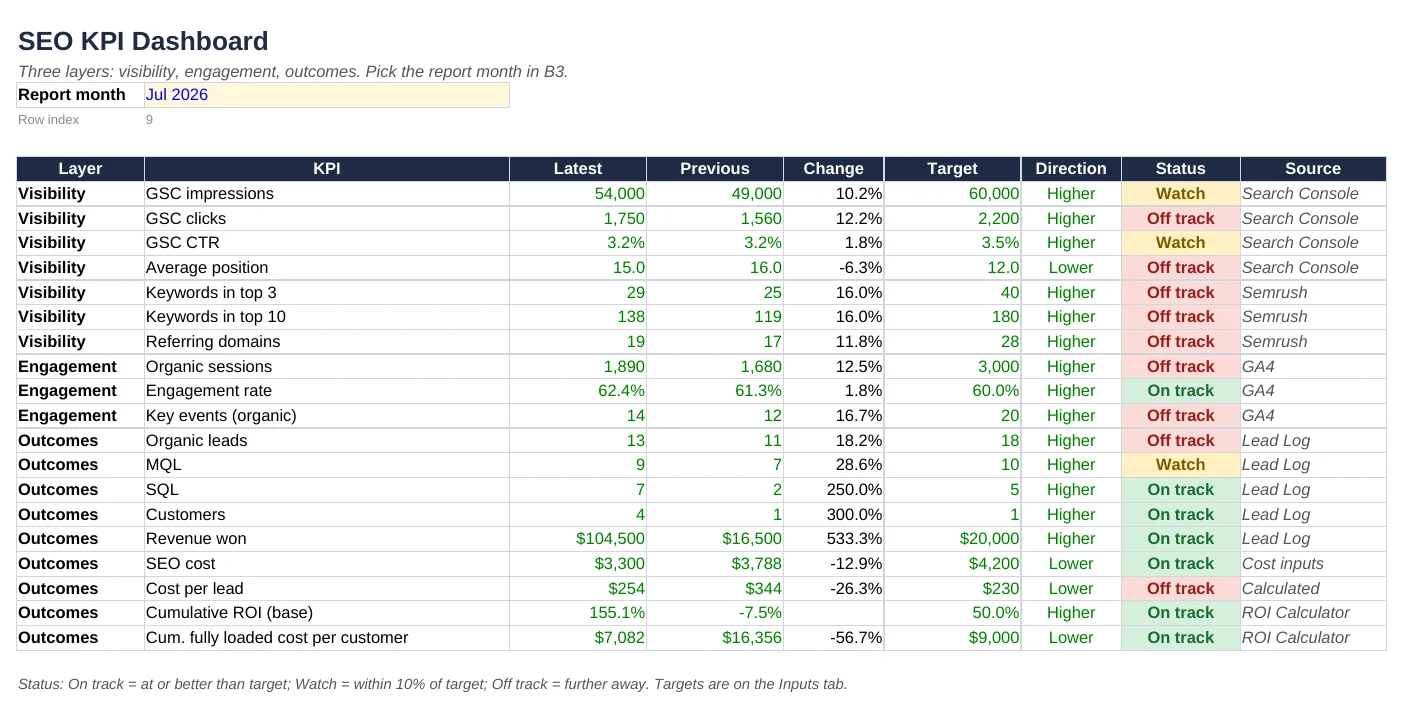
The monthly routine takes about half an hour once the template is set up:
- Set costs, margin, target ROI and KPI targets once on the Inputs tab.
- Log each new lead and update stage flags for leads that progressed.
- Paste the month’s Search Console, GA4 and Semrush figures and the cost inputs.
- Choose the report month on the dashboard and read the status by layer.
- Check the funnel against stage targets and note the weakest handoff.
- Read ROI and maximum CPL, then write three lines: what moved, why, what happens next.
Attribution without a CRM
Attribution is the weak point of any lead log. Two habits improve it. Store the visit source in hidden form fields so every lead keeps a permanent record of where it came from, and add a “How did you hear about us?” question, then compare the answers with the tracked source to find gaps (Shaffer, 2026).
The template adds a check column, the gap between GA4 key events and leads logged. A gap that persists points to spam, duplicates or missing log rows.
7. Common Mistakes.
Most distortions in an SEO report come from a short list of mistakes. Six are errors of method. The last is an error of working practice, and it quietly undermines the other six.
- Reporting revenue-based ROI. It more than doubled the example’s ROI (164% against 71%) because it ignores margin and sales cost.
- Leaving out internal time. Strategy, review and sign-off hours are part of the cost base (Chew, 2026).
- Judging SEO on a single month or a short window. Use cumulative curves and state the horizon.
- Treating every lead as equal. A lead is not a customer. Use stage rates and value per lead.
- Trusting default attribution. Reconcile GA4 events with the lead log and ask leads how they found you.
- Copying targets from benchmarks. Targets should come from your own history and your own unit economics.
- Working apart from sales and BD. Treating lead follow-up as another department’s business leaves the cost per lead incomplete and often wrong.
The last mistake deserves more space because the SEO team cannot fix it alone. Marketing owns the visits and the leads, but sales and BD own most of the inputs that make cost per lead credible: which leads qualified, how long each SQL took to work, what closing cost, what the deal was worth and why deals were lost.
Without those inputs the funnel rates are guesses and the fully loaded cost is understated. The MQL-to-SQL rate in particular depends on a definition of “qualified” that both teams must share.
A short agreement with sales fixes most of this. It should settle five points:
- Definitions: what counts as an MQL, an SQL and an opportunity, written down and applied the same way by both teams.
- Ownership: who updates the stage flags and deal values in the lead log, and by what day each month.
- Cost inputs: sales hours per SQL and closing and onboarding cost per won deal, reviewed at least once a quarter.
- Margin: the gross margin to use, confirmed with finance or the deal owner.
- Feedback: reasons for lost or unqualified leads, so that content and targeting can respond to them.
A 30-minute monthly review of the lead log with sales is enough to keep the numbers aligned. It also shifts the conversation from “SEO leads are low quality” to specific pages, queries and stages that can be improved.
Free template
SEO KPI and ROI Tracker (Google Sheet)
Nine tabs that put this framework into practice: Inputs, Lead Log, Monthly Data, KPI Dashboard, Funnel and Cost, ROI Calculator, Lead Value, Weekly Report and a README. Example data is fictional and the currency is USD. Open the link, choose Make a copy, delete the example rows in the Lead Log and replace the blue cells with your own numbers.
Make a copy of the Google Sheet ↗8. Final Thought: Report the Business, Not the Tool.
SEO reporting earns trust when it follows the money. Visibility and engagement KPIs explain what is happening, the lead generation flow shows what it costs, and profit-based ROI shows whether it was worth it. None of this needs advanced tooling: a lead log, honest cost inputs and a fixed set of targets are enough.
The numbers also depend on people outside the SEO team. Sales and BD hold the data that turns a cost per lead into a defensible one, so the routine works best when they help build it. Start with one month of data, review it together, and refine the assumptions as the log grows.
9. Frequently Asked Questions About SEO KPIs and ROI.
9.1 What are the most important SEO KPIs? +
Use three layers. For visibility, track Search Console impressions, clicks, CTR and average position, plus top 3 and top 10 keywords. For engagement, track organic sessions, engagement rate and key events in GA4. For outcomes, track organic leads, MQL, SQL, customers, revenue won, cost per lead and cumulative ROI. Set a target for each from your own history.
9.2 How do you calculate SEO ROI? +
SEO ROI is (attributed gross profit − fully loaded cost) ÷ fully loaded cost. Gross profit is revenue multiplied by gross margin. Fully loaded cost includes agency or freelancer fees, content, tools, internal hours, sales time and closing costs. Report the time horizon next to the result.
9.3 Is SEO ROI the same as ROAS? +
No. ROAS divides revenue by ad spend and suits channels with variable cost and fast results. SEO ROI uses gross profit and all costs, and SEO costs are mostly up-front while the assets keep earning afterwards. Compared on the same year, a ROAS-style ratio will look much higher than a profit-based ROI.
9.4 How long does SEO take to pay back? +
It depends on cost, sales cycle and attribution, so there is no single answer. Costs come before results, early months are usually negative, and a six-month window makes SEO look weaker than a 24-month one (Chew, 2026). Calculate the break-even month from your own data and treat it as the first month after which cumulative net profit stays at or above zero.
9.5 How can I track SEO leads without a CRM? +
Keep a lead log in a spreadsheet with one row per lead: date, channel, landing page and a 1 or 0 flag for MQL, SQL, opportunity and won, plus deal value. Save the visit source in hidden form fields, add a “How did you hear about us?” question, and reconcile GA4 key events with the log each month.
9.6 What is a good cost per lead for SEO? +
There is no universal figure. A good CPL is one below your own ceiling: value per lead minus non-SEO cost per lead is the break-even, and value per lead divided by (1 + target ROI), minus non-SEO cost per lead, is the target ceiling. The template calculates both.
References.
APA 7th edition. Example figures in this article come from the fictional data in the template.
- Chew, A. (2026, April 29). SEO ROI: How to calculate return on organic investment (methodology, not marketing). Stridec. https://stridec.com/blog/seo-roi/
- Coussons, C. (2026, March). SEO ROI in 2026: What the data actually shows. Visionary Marketing. https://visionary-marketing.co.uk/blog/seo-roi-data-2026
- Darko. (2026, May 7). How to calculate SEO ROI (and why most businesses get it wrong). Shortlist. https://shortlist.io/blog/how-to-calculate-seo-roi/
- Google. (n.d.-a). [GA4] Engagement rate and bounce rate. Analytics Help. https://support.google.com/analytics/answer/12195621
- Google. (n.d.-b). What are impressions, position, and clicks? Search Console Help. https://support.google.com/webmasters/answer/7042828
- Shaffer, D. (2026, October 7). SEO attribution: How to track leads, customers, and revenue from SEO. SEO.com. https://www.seo.com/blog/seo-attribution